The-Art-of-Problem-Solving-in-Software-Engineering_How-to-Make-MySQL-Better
4.6 Queueing Theory
Queueing theory is the mathematical study of waiting lines or queues, used to predict queue lengths and waiting times [45]. It is widely applied in computer science and information technology. For example, in networking, routers and switches rely on queues to manage packet transmission. By applying queueing theory, designers can optimize these systems for responsive performance and efficient resource utilization. Although queueing theory is not specifically designed to improve software performance, it serves as a model for evaluating system efficiency by examining how resources, both physical and logical, are utilized. According to queueing theory, almost any resource can be viewed as a queue, and bottleneck resources can be analyzed this way to better understand their characteristics.
4.6.1 Single Queue Bottleneck
The following figure depicts a scenario where MySQL primary and MySQL secondary form a two-node cluster under a network latency of 10ms.
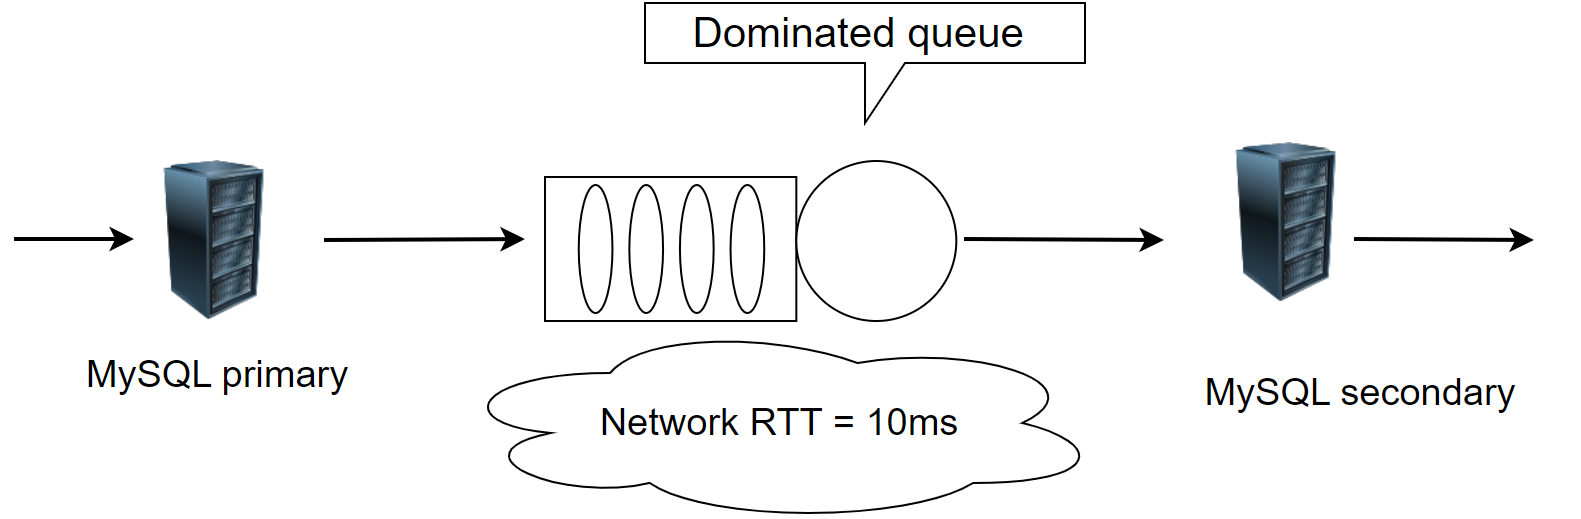
Figure 4-23. Testing architecture for Group Replication with pure Paxos protocol
The cluster’s Paxos algorithm employs a modified Mencius approach, removing batching and pipelining, making it similar to pure Paxos. Tests were conducted at various concurrency levels under a network latency of 10ms, as illustrated in the following figure:
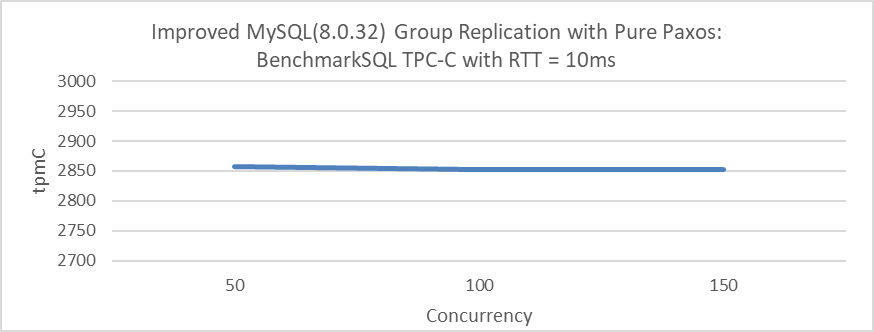
Figure 4-24. Results of testing Group Replication with pure Paxos protocol
In a WAN testing scenario, the throughput remains nearly constant across different concurrency levels—50, 100, or 150—because the time MySQL takes to process TPC-C transactions is negligible compared to the network latency of 10ms. This network latency dominates the overall transaction time, making the impact of concurrency changes relatively insignificant.
The throughput calculation formula in such scenarios simplifies to:

This closely matches the test results above, where 0.45 is an empirical factor derived from extensive testing that represents the ratio of tpmC to tpmTOTAL. The tests indicate that, under a 10ms network latency with no additional bottlenecks, throughput remains consistent across different concurrency levels. This consistency is due to the serial nature of Paxos communication, as batching and pipelining are not employed. Confirmation of these findings is supported by packet capture analysis.
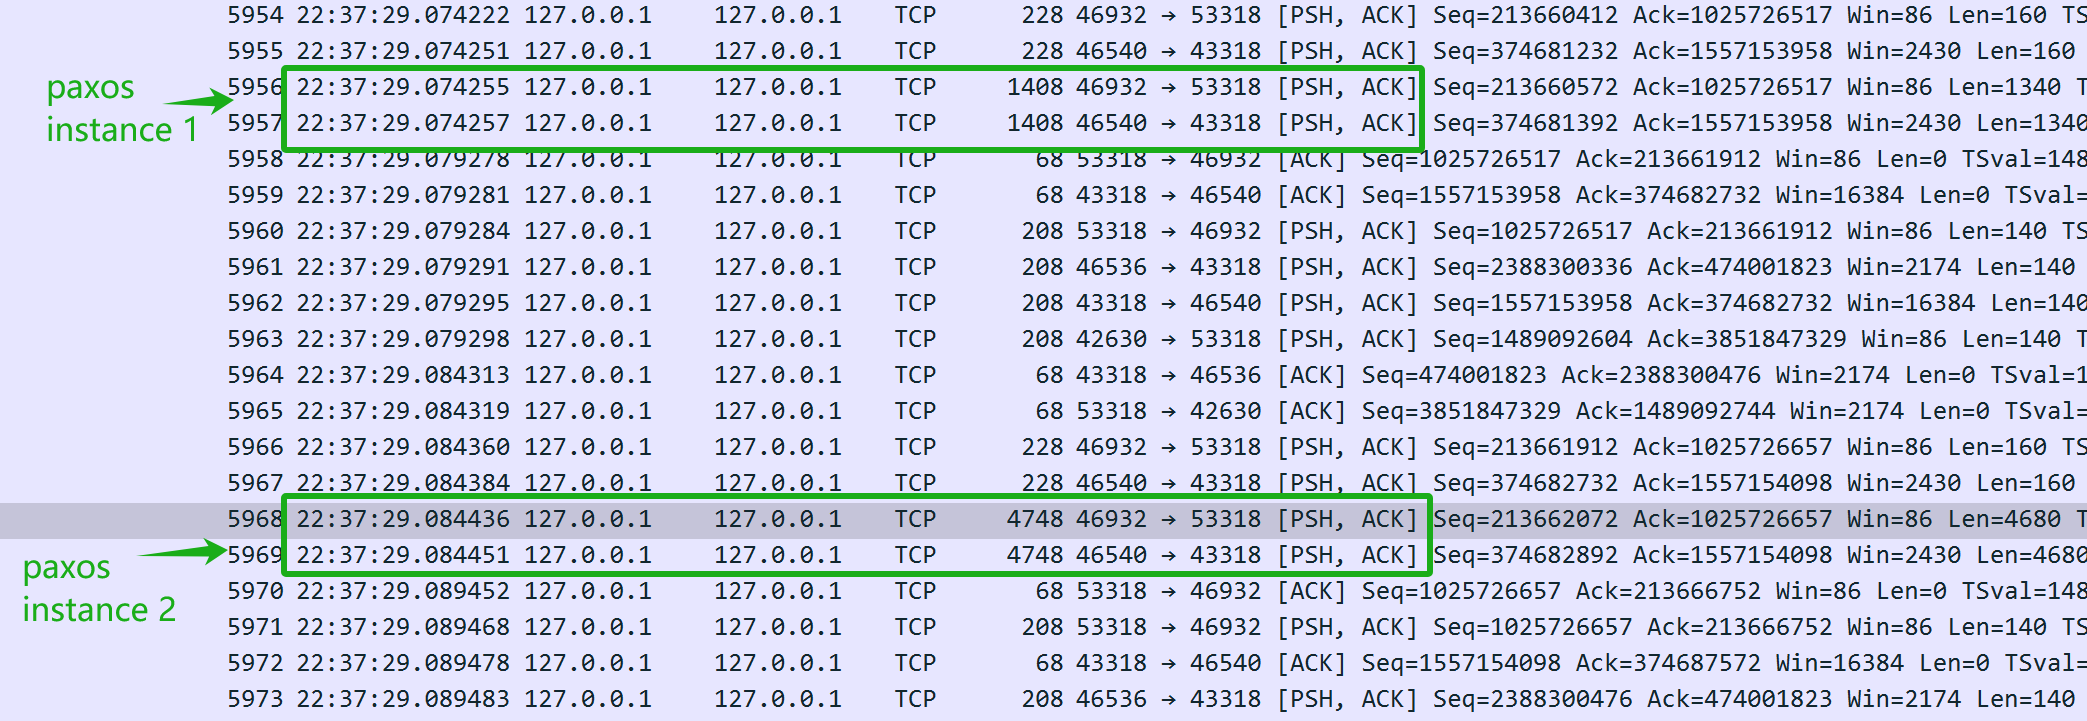
Figure 4-25. Insights into the pure Paxos protocol from packet capture data.
In the figure, the network latency between the two Paxos instances is approximately 10ms, matching the exact network delay. Numerous examples suggest that pure Paxos communication is inherently serial. In scenarios where network latency is the predominant factor, it acts as a single queue bottleneck. Consequently, regardless of concurrency levels, the throughput of pure Paxos is limited by this network latency.
4.6.2 Multiple Queue Bottlenecks
A complex program often involves multiple queues, and unless one queue dominates, several bottlenecks can exist simultaneously. The figure below illustrates a basic server queue model with a single CPU and two disks. When the CPU is busy, requests are queued, and the same happens when accessing the disks. In this model, queueing theory can be applied to calculate the server’s throughput capacity.
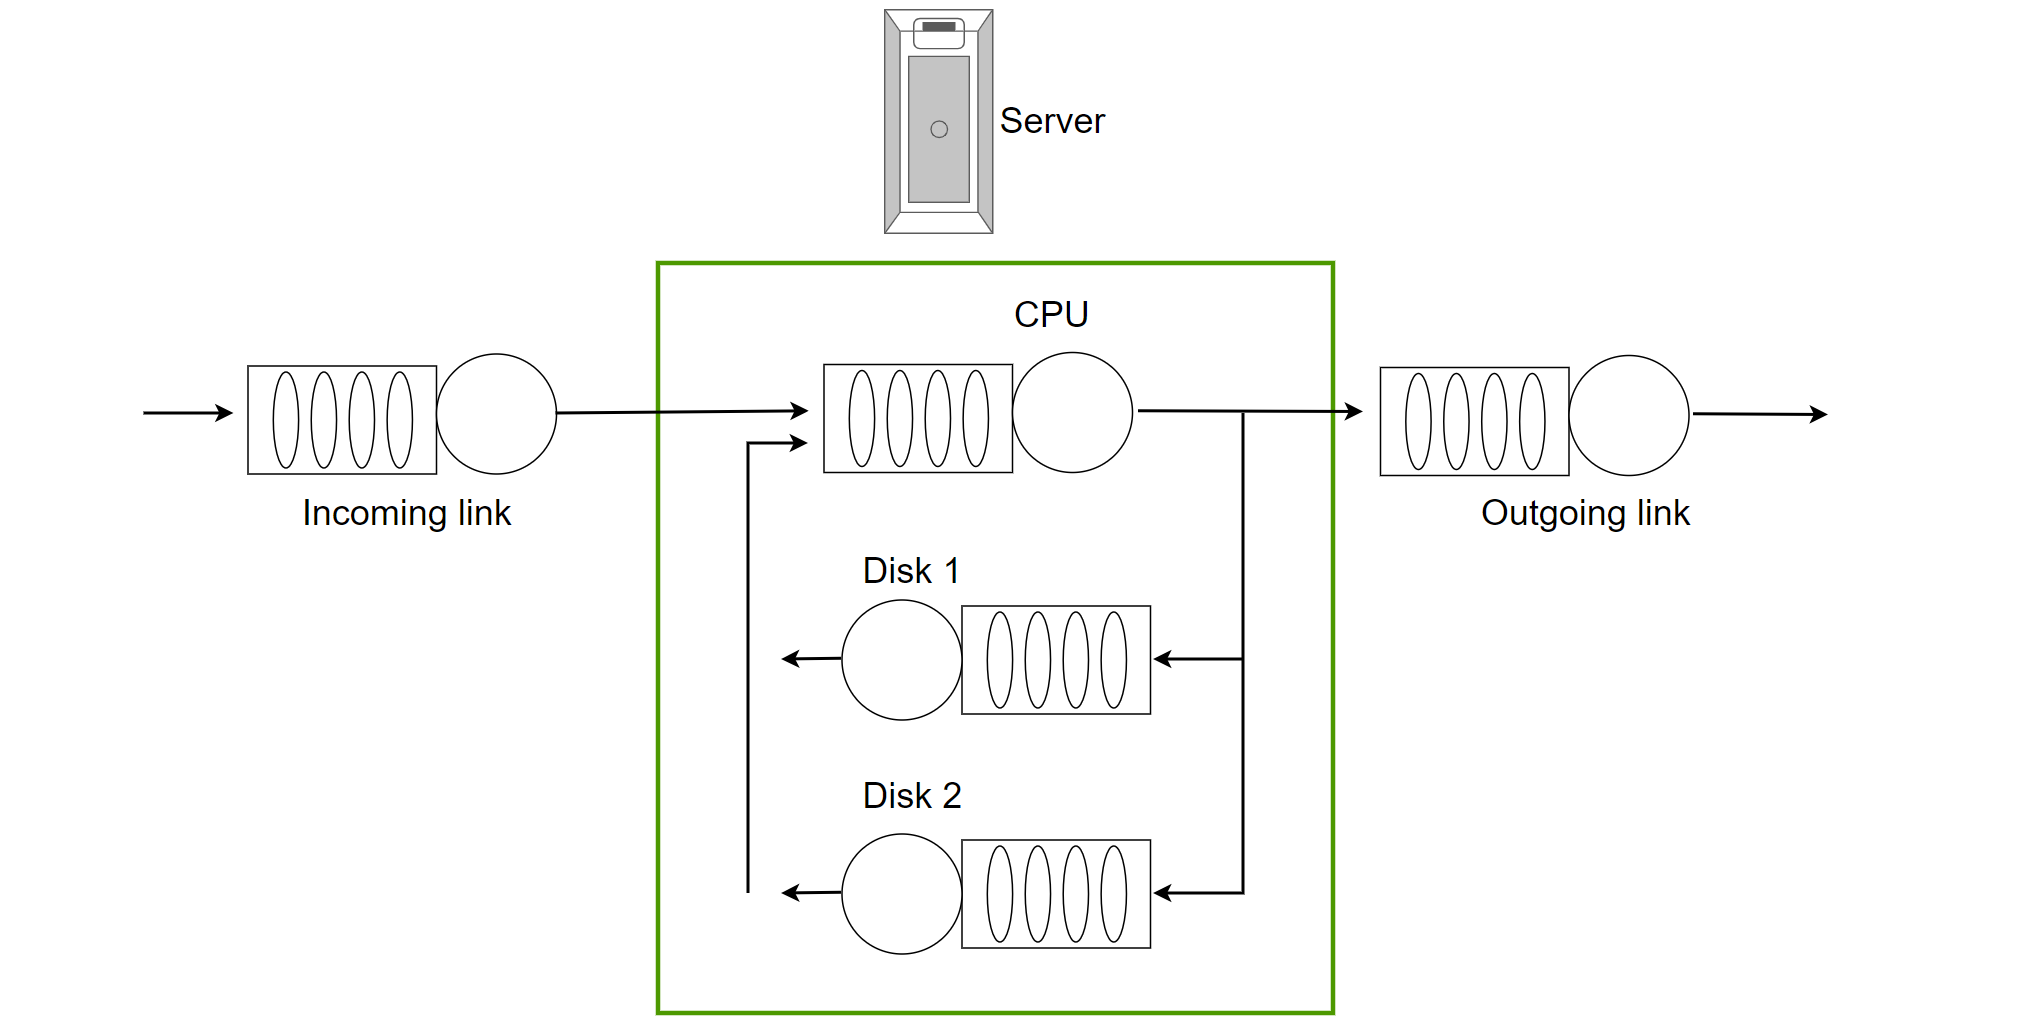
Figure 4-26. A basic server queue model with single CPU and dual Disks.
In modern NUMA environments with abundant CPUs and cross-NUMA access interference, directly calculating system throughput using queueing theory can be challenging. For instance, the following figure illustrates the latch queue model of MySQL 5.7.
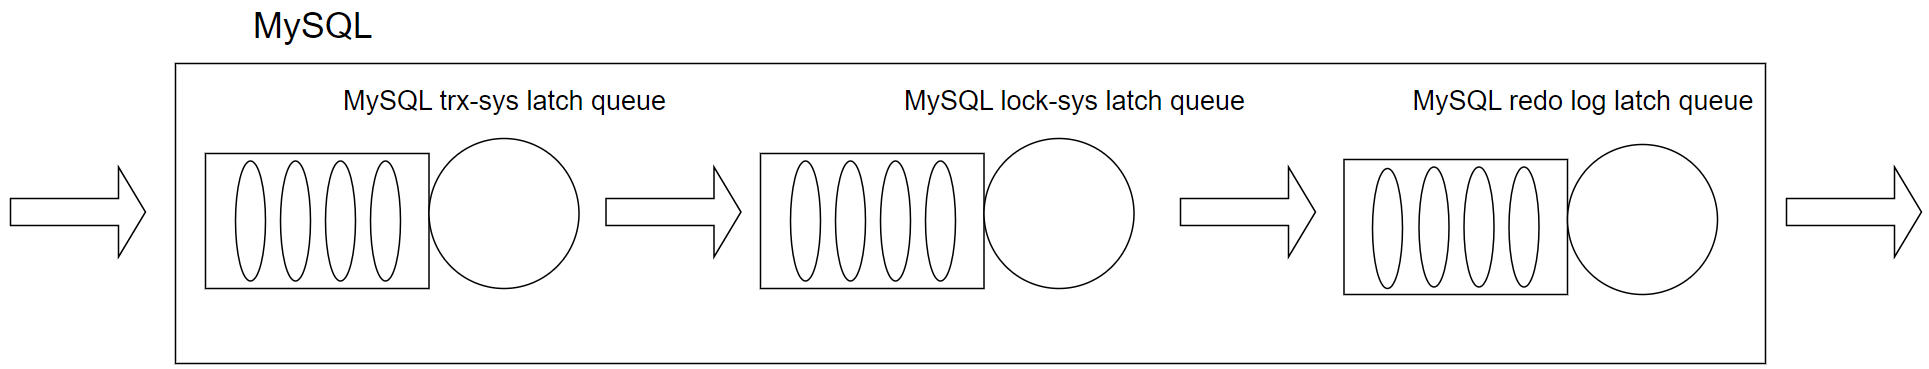
Figure 4-27. The latch queue model in MySQL 5.7.
This involves the latch queue bottlenecks within the InnoDB storage engine, a significant scalability problem in MySQL 5.7. In this queue model, addressing individual bottlenecks alone is insufficient to solve scalability problems, and accurately assessing the impact of these queue bottlenecks on throughput remains challenging.
4.6.3 The Mutual Influence Between Different Queue Bottlenecks
The following figure is a simplified example of a multi-queue model in a NUMA environment.
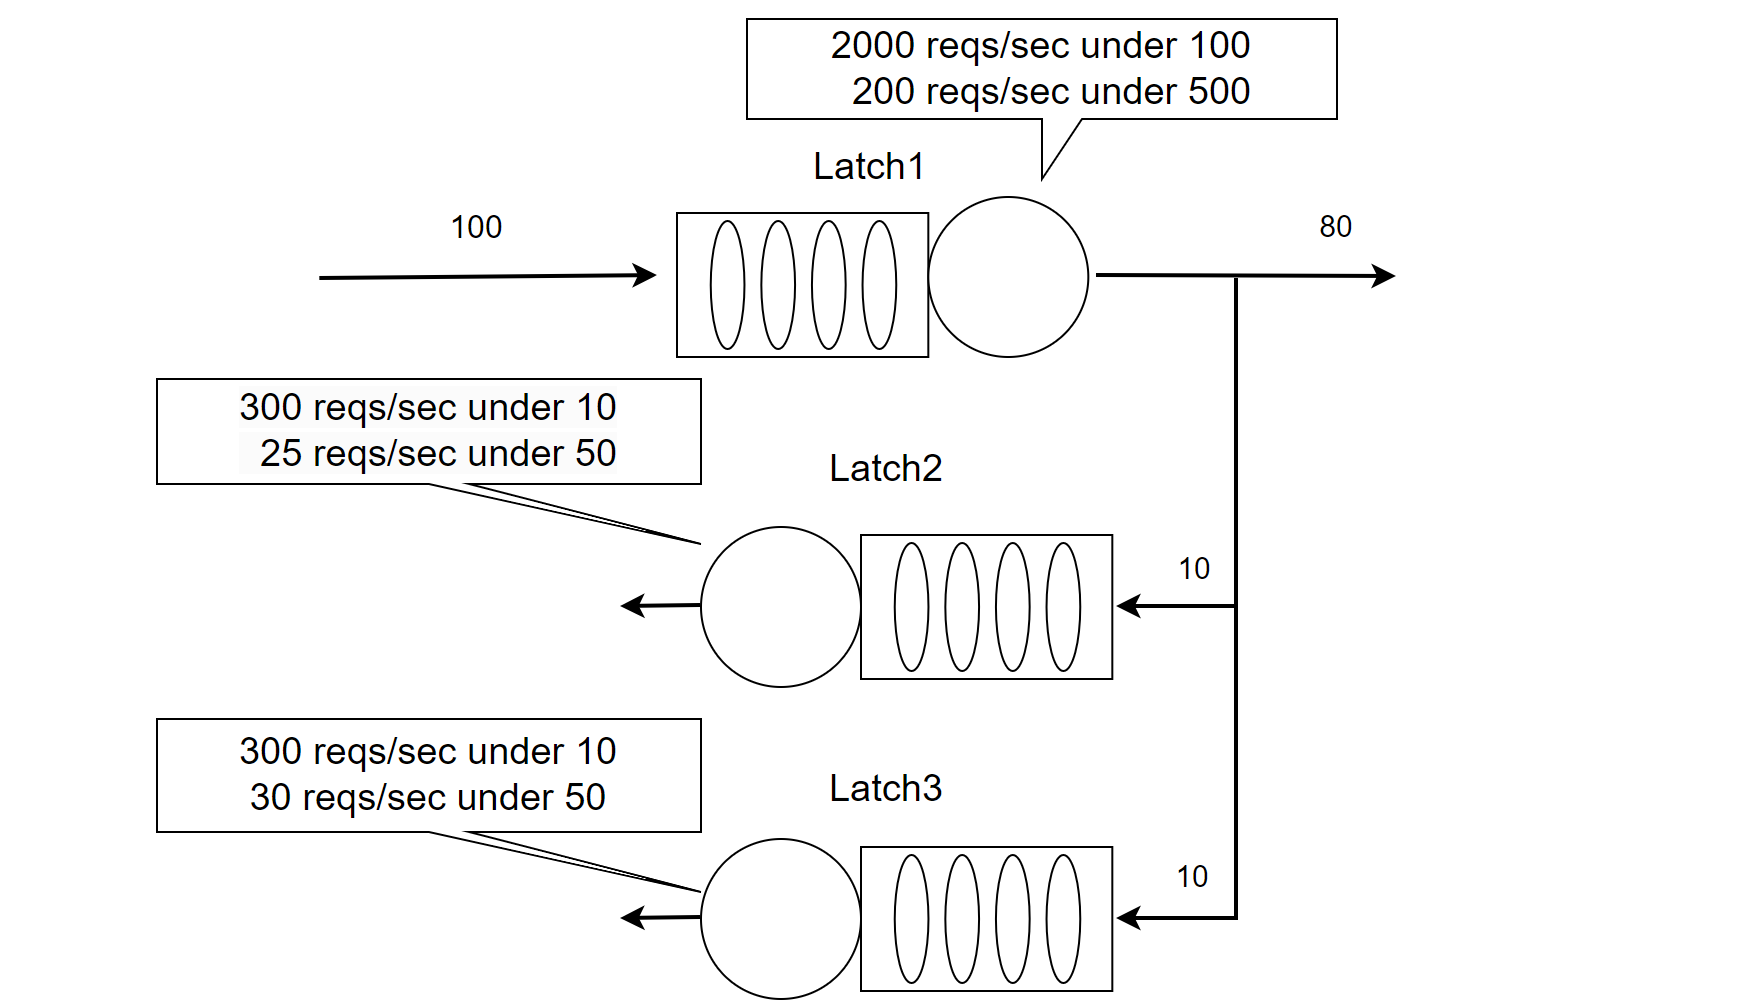
Figure 4-28. A multi-queue model in a NUMA Environment.
In the case of 100 concurrent threads, the latch1 queue can handle 2,000 requests per second. However, with 500 concurrent threads, its throughput drops to only 200 requests per second. This discrepancy arises because increased conflicts lead to significant context switching, causing cache content to migrate across NUMA nodes, which sharply reduces memory access efficiency. As concurrency rises, this inefficiency grows, leading to a notable decline in throughput.
Under normal conditions, with 100 concurrent threads passing through latch1, 10 threads typically proceed to latch2 and another 10 to latch3. Both latch2 and latch3 can handle 300 requests per second with 10 concurrent threads, meaning that no bottlenecks are encountered.
When 500 concurrent threads interact with latch1, the increased conflicts result in fewer requests successfully passing through, leading to reduced throughput. After identifying and optimizing latch1 (as shown in the figure below), its throughput capacity increased significantly: it can now handle 1,000 requests per second with 500 concurrent threads. This optimization has effectively mitigated the previous performance degradation caused by latch1 conflicts.
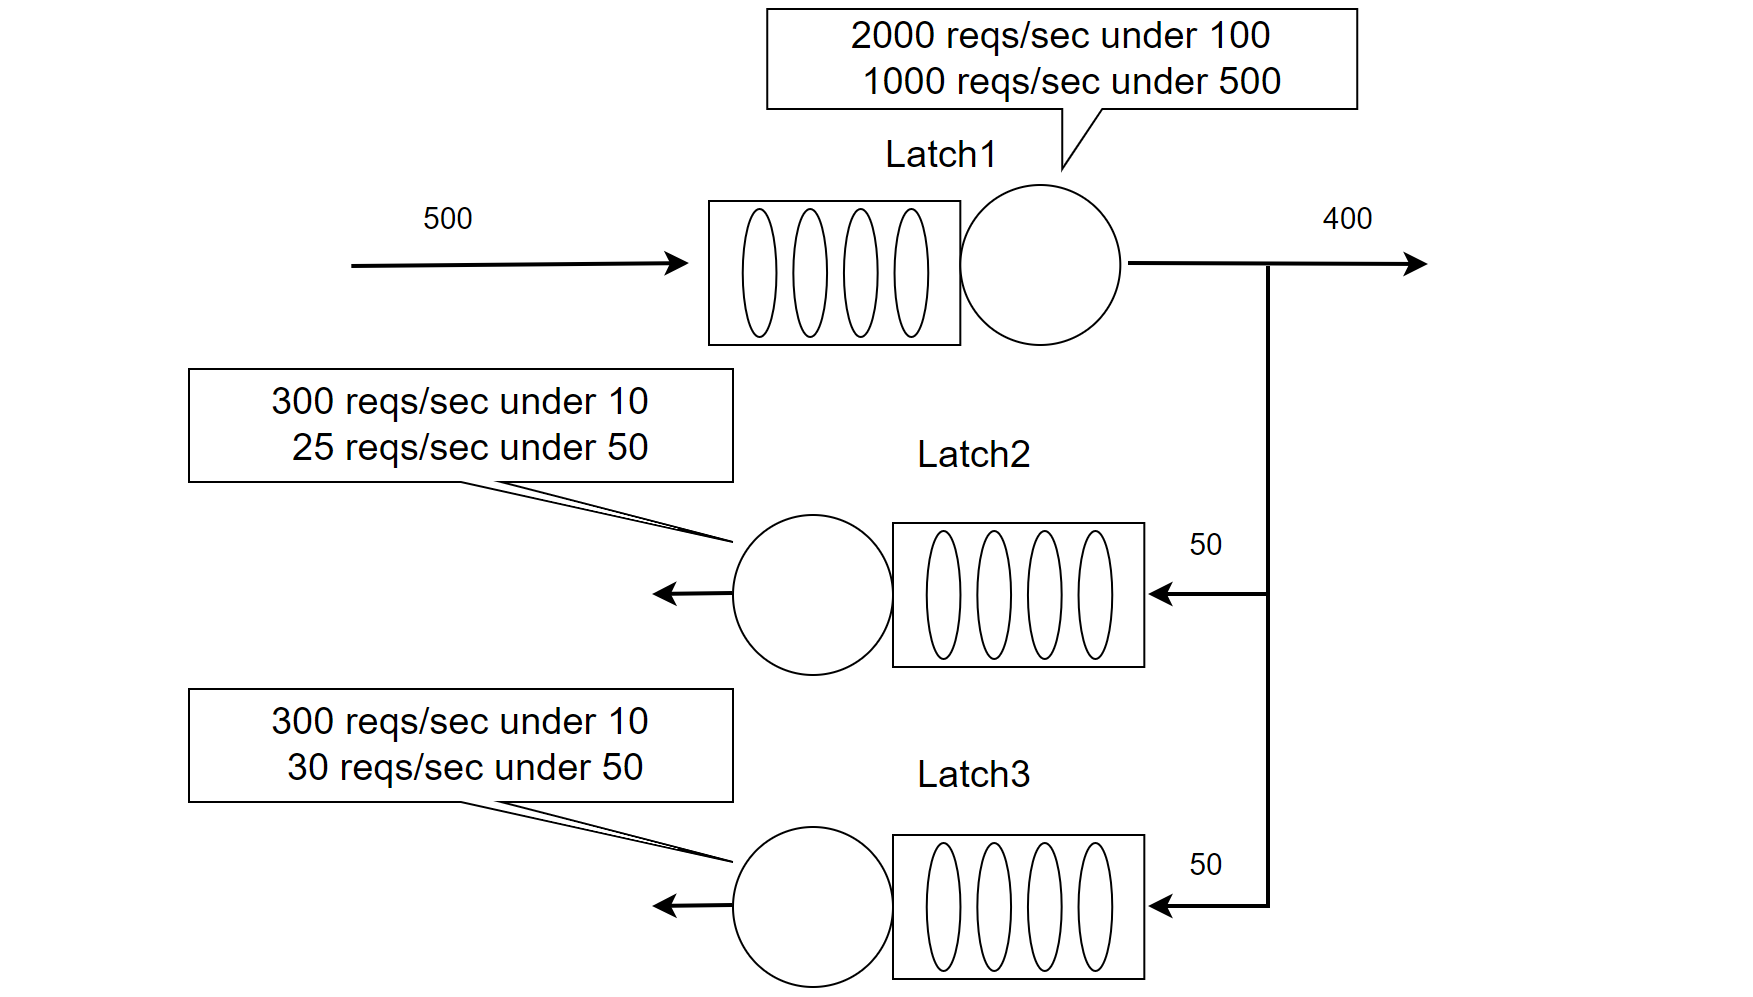
Figure 4-29. A multi-queue model mitigating latch1 bottleneck in NUMA environments.
With 500 concurrent threads reaching the latch1 queue, the improved processing efficiency allows 50 threads to progress to latch2 and another 50 to latch3. However, severe conflicts at both latch2 and latch3 reduce their processing capacities to just 25 and 30 requests per second, respectively. This disrupts the balance of latch2 and latch3 queues, which were stable before optimizing latch1.
In the scenario of multi-queue bottlenecks, optimizing one bottleneck may not necessarily lead to an increase in overall throughput; it could potentially even decrease throughput. Real-life examples of this include instances where Profile-Guided Optimization (PGO) led to decreased throughput under high concurrency, illustrating this phenomenon.
Let’s review again the throughput situation under high concurrency after applying PGO:
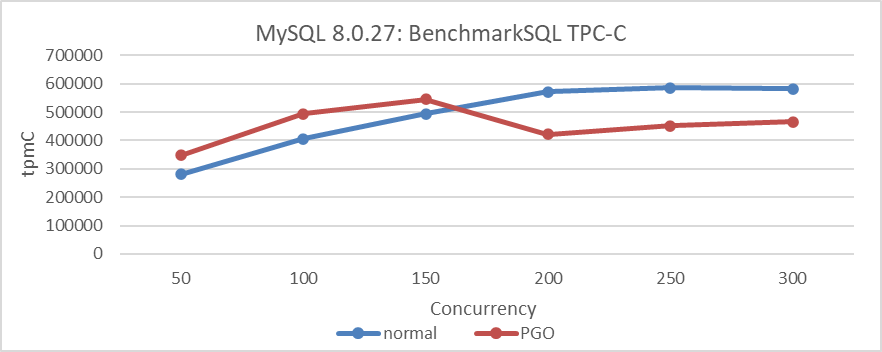
Figure 4-30. Performance comparison tests before and after using PGO in MySQL 8.0.27.
Profile-Guided Optimization (PGO) accelerates CPU computation efficiency, enabling a larger number of threads to enter the latch queue earlier under high concurrency. This exacerbates latch conflicts compared to the pre-optimization state, leading to decreased throughput. Interestingly, when PGO is disabled, throughput decreases under low concurrency but increases under high concurrency. This counterintuitive phenomenon is common when multi-queue bottlenecks coexist.
Let’s examine the performance comparison before and after redo log optimization:
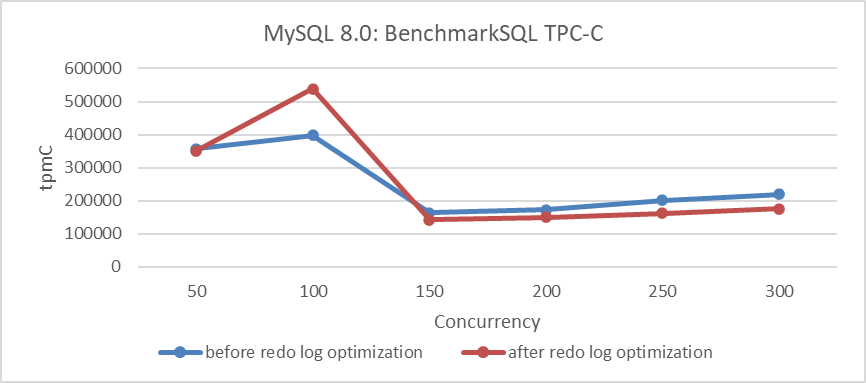
Figure 4-31. Performance comparison tests before and after redo log optimization in MySQL 8.0.
The figure shows that performance improves under low concurrency but decreases under high concurrency. This repeatedly tested phenomenon indicates that not all optimizations show immediate results; eliminating disturbances is crucial to observe true effectiveness. These problems often occur in NUMA environments, so mitigating NUMA compatibility problems is essential to avoid misjudgments in performance optimization. Developers’ reliance on data can overlook the real reasons for performance declines, leading to missed optimization opportunities.
4.6.4 The Relationship Between Resource Utilization and Response Time
According to queueing theory, as resource utilization increases, average response time also increases, and as utilization approaches 100%, average response time deteriorates sharply. The following figure shows concurrent tests on CPU resources using SysBench, displaying the relationship between average response time and CPU utilization. Initially, the average response time increases slowly. However, around 60% CPU utilization, the curve sharply rises, reaching over 13 milliseconds at 96% utilization.
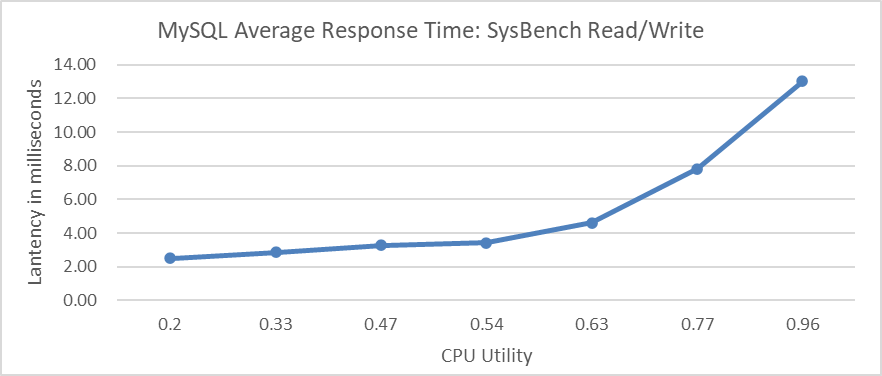
Figure 4-32. Relationship between average response time and CPU utilization.
If resources are depleted, such as running out of memory, the machine’s response time can become very slow. Therefore, controlling resource utilization is essential. According to queueing theory, for MySQL OLTP systems, maintaining response times requires keeping utilization within certain limits. Finding the optimal utilization point is crucial to maintain efficiency, which is the basis of transaction throttling theory. While queueing theory doesn’t directly solve problems, it provides guidance for performance optimization and deepens the understanding of system performance.
4.6.5 Transaction Throttling Mechanism
To prevent performance degradation, controlling resource usage is crucial. For MySQL OLTP applications, managing concurrency entering the transaction system is key due to multiple latch queue bottlenecks and the replication of global active transaction lists.
A practical transaction throttling mechanism for MySQL is as follows:
- Before entering the transaction system, check if the number of concurrent processing threads exceeds the limit.
- If the limit is exceeded, block the user thread until other threads activate this thread.
- If the limit is not exceeded, allow the thread to proceed with processing within the transaction system.
- Upon transaction completion, activate the first transaction in the waiting queue.
This approach helps maintain performance by controlling concurrency and managing resource usage effectively. The following figure illustrates the relationship between TPC-C throughput and concurrency under transaction throttling conditions, with 1000 warehouses.
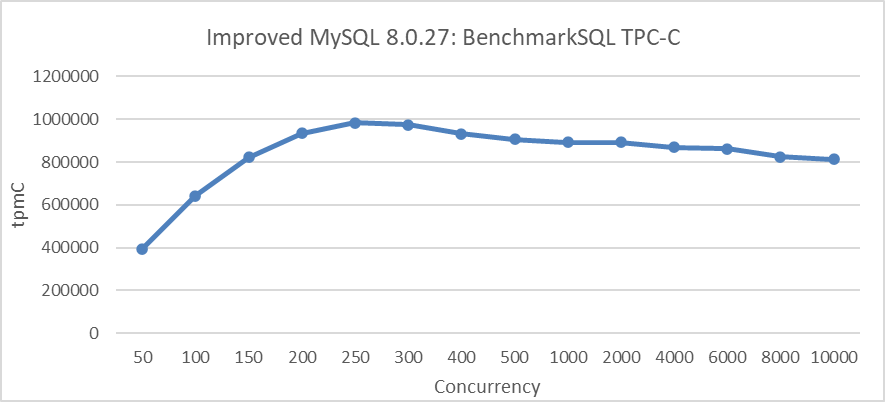
Figure 4-33. Maximum TPC-C throughput in BenchmarkSQL with transaction throttling mechanisms.
From the figure, it is evident that implementing transaction throttling mechanisms significantly improves MySQL’s scalability.